A) 1/2.
B) 2/3.
C) 1.
D) 2.
E) 3.
G) D) and E)
Correct Answer

verified
Correct Answer
verified
Multiple Choice
A university decides to change its late night bus service between the campus and student housing from a fare-based service to a free service. This statement means that the incentive to ride the bus ________ and the opportunity cost of a bus ride ________.The university's decision is a ________ decision.
A) changes; decreases; microeconomic
B) changes; decreases; macroeconomic
C) remains the same; remains the same; macroeconomic
D) remains the same; remains the same; microeconomic
E) changes; increases; microeconomic
G) B) and D)
Correct Answer

verified
Correct Answer
verified
Multiple Choice
Which one of the following is an example of capital?
A) money
B) a carpenter
C) pasture
D) a bread-slicing machine
E) a university professor
G) A) and D)
Correct Answer

verified
Correct Answer
verified
Multiple Choice
The expansion of international trade, borrowing and lending, and investment is
A) the big tradeoff.
B) industrial revolution.
C) corporate revolution.
D) globalization.
E) antiglobalization.
G) D) and E)
Correct Answer

verified
Correct Answer
verified
Multiple Choice
Complete the following sentence.Economic models
A) do not answer questions about the economic world.
B) include most of the details of the economic world.
C) describe some aspect of the economic world, but include only those features needed for the purpose at hand.
D) answer questions that arise from normative statements.
E) were first developed in the 1970s.
G) All of the above
Correct Answer

verified
Correct Answer
verified
Multiple Choice
Which one of the following is an example of land?
A) Bono's singing voice
B) a computer program
C) Lake Erie
D) a road
E) a dam
G) D) and E)
Correct Answer

verified
Correct Answer
verified
Multiple Choice
Use the figure below to answer the following questions.
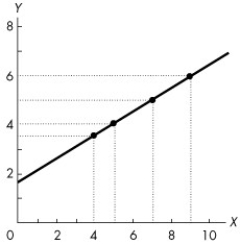 Figure 1A.2.1
-In Figure 1A.2.1, the value of y is 5 when x is
A) 4.
B) 5.
C) 6.
D) 7.
E) 8.
G) A) and D)
Correct Answer

verified
Correct Answer
verified
Multiple Choice
Which one of the following is labour?
A) money
B) a carpenter's hammer
C) a shoe factory
D) a bread-slicing machine
E) a singer's voice
G) All of the above
Correct Answer

verified
Correct Answer
verified
Multiple Choice
Use the figure below to answer the following question.
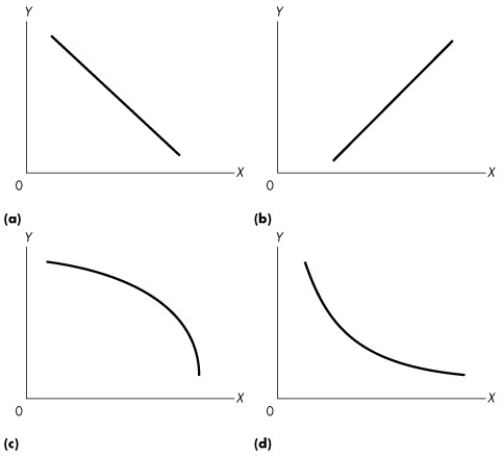 Figure 1A.2.6
-Refer to Figure 1A.2.6.Consider the values for x and y given in the following table:
  Which one of the graphs in Figure A1.13 represents the relationship between x and y?
A) (a)
B) (b)
C) (c)
D) (d)
E) (a) and (b)
G) C) and D)
Correct Answer

verified
Correct Answer
verified
Multiple Choice
To graph a relationship among three variables we
A) hold two variables constant to graph the third variable.
B) hold one variable constant and graph the relationship between the other two variables.
C) graph each of the three variables using a separate set of axes.
D) must be able to draw in three dimensions.
E) must be able to allow all three variables to vary simultaneously in one graph.
G) A) and C)
Correct Answer

verified
Correct Answer
verified
Multiple Choice
Use the figure below to answer the following questions.
 Figure 1A.1.5
-Refer to Figure 1A.1.5.Which graph or graphs indicates a negative relationship between x and y?
A) (a)
B) (b)
C) (c)
D) (d)
E) (b) and (d)
G) B) and C)
Correct Answer

verified
Correct Answer
verified
Multiple Choice
An economic model is tested by
A) examining the realism of its assumptions.
B) comparing its predictions with the facts.
C) comparing its complexity to other models that deal with similar issues.
D) the Testing Committee of the Canadian Economic Association.
E) comparing its descriptions and examining the realism of its assumptions.
G) A) and C)
Correct Answer

verified
Correct Answer
verified
Multiple Choice
Use the table below to answer the following questions.
Table 1A.3.2
 -Refer to Table 1A.3.2.Suppose that w is measured along the x-axis.The slope of the line relating w and u is
A) +3.
B) -3.
C) -2/3.
D) +3/2.
E) -3/2.
G) A) and B)
Correct Answer

verified
Correct Answer
verified
Multiple Choice
The scientific purpose of simplifying assumptions in an economic model is to
A) avoid confronting difficult issues.
B) eliminate the need for further testing of the implications of the model.
C) abstract from the complexities of the real world those issues that are not important for the issues under examination.
D) eliminate the possibility of personal bias in the model.
E) add necessary hypotheses to the problem.
G) None of the above
Correct Answer

verified
Correct Answer
verified
Multiple Choice
Use the figure below to answer the following question.
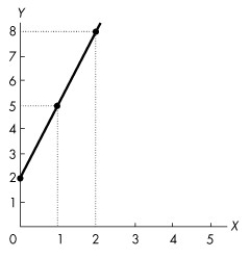 Figure 1A.5.2
-The equation of a line is y = 4 + 2x.What is the x-intercept of this line?
A) 4
B) -2
C) -1/2
D) 1/4
E) 0
G) All of the above
Correct Answer

verified
Correct Answer
verified
Multiple Choice
Use the figure below to answer the following questions.
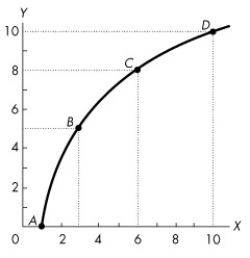 Figure 1A.3.3
-What is the slope across the arc between B and C in Figure 1A.3.3?
A) 1/2.
B) 2/3
C) 1
D) 2
E) 3
G) All of the above
Correct Answer

verified
Correct Answer
verified
Multiple Choice
Use the figure below to answer the following question.
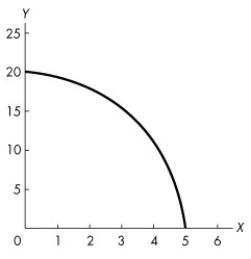 Figure 1A.3.11
-Refer to Figure 1A.3.11.The graph shows a ________ relationship.The absolute value of the slope of the relationship ________ as the value of x increases.
A) positive; increases
B) positive; decreases
C) negative; decreases
D) negative; increases
E) negative; does not change
G) A) and D)
Correct Answer

verified
Correct Answer
verified
Multiple Choice
Which one of the following is a necessary consequence of scarcity?
A) no choices required
B) high profits
C) the requirement of making choices
D) all wants are satisfied
E) low profits
G) A) and D)
Correct Answer

verified
Correct Answer
verified
Multiple Choice
When the government chooses to use resources to build a dam, those resources are no longer available to build a highway.This illustrates the concept of
A) a market.
B) macroeconomics.
C) opportunity cost.
D) a "how" tradeoff.
E) the big tradeoff.
G) A) and D)
Correct Answer

verified
Correct Answer
verified
Multiple Choice
Use the table below to answer the following questions.
Table 1A.3.2
 -In Table 1A.3.2, suppose that w is measured along the x-axis.The slope of the line relating w and u is
A) positive with a decreasing slope.
B) negative with a decreasing slope.
C) positive with an increasing slope.
D) negative with a constant slope.
E) positive with a constant slope.
G) B) and C)
Correct Answer

verified
Correct Answer
verified
Showing 121 - 140 of 212
Related Exams