B) False
Correct Answer

verified
Correct Answer
verified
Multiple Choice
The part of a graph that is most applicable to marginal analysis is the
A) origin
B) slope
C) horizontal axis
D) dependent variable
E) inverse relation
G) B) and D)
Correct Answer

verified
Correct Answer
verified
Multiple Choice
A line on a graph will shift if
A) the independent variable changes
B) there are no changes in any variables considered in the model
C) there is a change in a variable that had previously been assumed to be constant
D) a change in the independent variable causes a change in the dependent variable
E) the independent variable and the dependent variable are unrelated
G) B) and C)
Correct Answer

verified
Correct Answer
verified
True/False
A U-shaped curve has a positive slope everywhere.
B) False
Correct Answer

verified
Correct Answer
verified
Multiple Choice
A line is tangent to a curve if it
A) crosses the curve at one point
B) touches the curve at one point,without crossing it
C) crosses the curve at a minimum of two points
D) never touches the curve
E) forms a right triangle with the curve
G) D) and E)
Correct Answer

verified
Correct Answer
verified
Multiple Choice
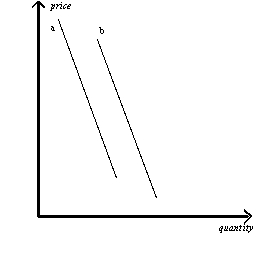
Exhibit 1-13  -Refer to Exhibit 1-13.The reason that Line (a) would shift to the position of Line (b) is
A) a change in quantity
B) a change in price
C) a change in an assumption about the relationship between the two variables observed
D) a change from a positive relation to a negative relation
E) a change from a negative relation to a positive relation
G) B) and E)
Correct Answer

verified
Correct Answer
verified
True/False
The slope of a vertical straight line is infinity.
B) False
Correct Answer

verified
Correct Answer
verified
Multiple Choice
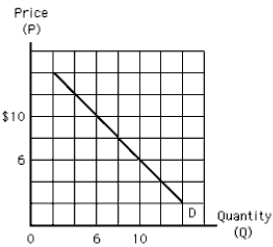
Exhibit 1-4  -Along the curve in Exhibit 1-4,
A) if P = $6,then Q = 8
B) if Q = 10,then P = $4
C) the slope is equal to -1
D) Q increases as P increases
E) there is a positive relationship between Q and P
G) A) and E)
Correct Answer

verified
Correct Answer
verified
True/False
If the dependent variable Y is directly related to the independent variable X,this means that changes in X cause changes in Y.
B) False
Correct Answer

verified
Correct Answer
verified
Multiple Choice
 -Suppose y is measured on the vertical axis,x is on the horizontal axis,and the various combinations of x and y are shown by a nonvertical straight line.Which of the following must be true?
A) There is a negative relation between x and y.
B) There is a positive relation between x and y.
C) There is a causal relation between x and y.
D) If the value of x is known,the value of y can be determined.
E) The value of y is independent of the value of x.
G) B) and D)
Correct Answer

verified
Correct Answer
verified
True/False
The numerical value of the slope of a line depends in part on the units of measurement used.
B) False
Correct Answer

verified
Correct Answer
verified
True/False
The slope of a horizontal straight line is infinity.
B) False
Correct Answer

verified
Correct Answer
verified
Multiple Choice
Suppose a graph with Ron's weight on the vertical axis and his consumption of ice cream on the horizontal axis indicated that for each serving of ice cream he ate,Ron would gain 3 pounds,regardless of how much ice cream he had already eaten.This graph would show a
A) horizontal line at weight = 3
B) straight line with slope = 3
C) straight line with slope = 1/2
D) straight line with slope = -3
E) straight line with slope = -1/3
G) A) and C)
Correct Answer

verified
Correct Answer
verified
Multiple Choice
If slope = 2 for a line on a graph with x on the horizontal axis and y on the vertical axis,then if
A) x decreases by 4,y decreases by 8
B) x = -4,then y = -2
C) y decreases by 4,x decreases by 8
D) x = -4,y = -8
E) x increases by 4,y decreases by 8
G) All of the above
Correct Answer

verified
Correct Answer
verified
Multiple Choice
On a graph,the origin represents
A) the dependent variable
B) the variable that is the primary source of causation
C) a caption or explanatory description of the symbols,colors,and measurements used on the graph
D) the point at which the values of both variables are zero
E) ancestry
G) B) and E)
Correct Answer

verified
Correct Answer
verified
Multiple Choice
The slope of a line
A) can only be calculated for straight lines
B) varies at different points along a straight line
C) indicates whether or not there is a causal relationship between variables
D) is independent of the units of measurement used
E) indicates how much the vertical variable changes for a given change in the horizontal variable
G) B) and C)
Correct Answer

verified
Correct Answer
verified
Multiple Choice
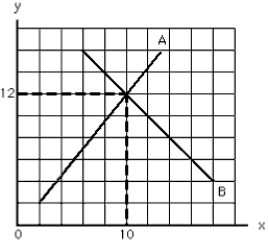
Exhibit 1-2  -In Exhibit 1-2,at x = 10,the
A) value of y is larger on curve A than on curve B
B) value of y is smaller on curve A than on curve B
C) value of y is the same on curve A as on curve B
D) slope of line A is negative
E) slope of line B is positive
G) D) and E)
Correct Answer

verified
Correct Answer
verified
Multiple Choice
A tangent line is a straight line
A) that intersects a curved line twice
B) with a slope equal to infinity
C) that touches a curved line at only one point
D) that intersects a curved line at several points
E) that runs along the vertical axis
G) B) and D)
Correct Answer

verified
Correct Answer
verified
Multiple Choice
Most economics graphs reflect the relationship between how many economic variables?
A) three
B) two
C) four
D) thirty
E) twenty
G) A) and B)
Correct Answer

verified
Correct Answer
verified
Showing 41 - 59 of 59
Related Exams