A) 100%
B) 1 meter per kilometer
C) 15 meters per kilometer
D) 15 kilometers per meter
E) none of these
G) A) and C)
Correct Answer

verified
Correct Answer
verified
Multiple Choice
The size of clasts that a stream can carry is primarily controlled by:
A) the water temperature
B) the dissolved and suspended load of a stream
C) how close the stream is to the ocean
D) the velocity and turbulence of the current
E) whether it is a permanent or ephemeral stream
G) B) and C)
Correct Answer

verified
Correct Answer
verified
Multiple Choice
What is the mostly likely setting for this drainage pattern? 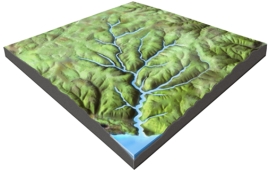
A) the rocks have a relatively equal resistance to erosion
B) drainages have followed a series of fractures that branch off of one another
C) the area has folded or faulted rocks with different resistances to erosion
D) a volcano once existed here but has been partly eroded away
F) A) and C)
Correct Answer

verified
Correct Answer
verified
Multiple Choice
Based on the accompanying hydrograph,what was the stream discharge when the data period shown in the graph ended? 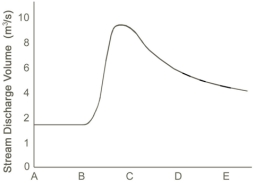
A) 1.8 meters per second
B) 4 meters per second
C) 4 cubic meters per second
D) 9 cubic meters per second
E) 10 cubic meters per second
G) A) and C)
Correct Answer

verified
Correct Answer
verified
Multiple Choice
Using this plot of annual peak discharge,what is the probability each year that a flood of 1,000 cubic meters per second will occur? 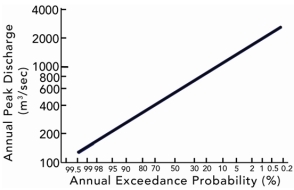
A) 1 in 1,000,or 0.01%
B) 1 in 100,or 1% (100-year flood)
C) between 10 and 20%
D) more than 20%
F) B) and C)
Correct Answer

verified
Correct Answer
verified
Multiple Choice
Compared with curve 2 on this hydrograph,what is a possible explanation for curve 1? 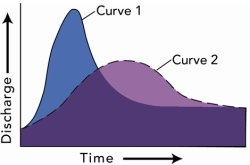
A) the basin for curve 1 has steeper slopes than the basin for curve 2
B) the storm recorded by curve 1 was shorter and more intense than the storm represented by curve 2
C) curve 1 shows the same area as curve 2 but after urbanization
D) all of these are possible
F) All of the above
Correct Answer

verified
Correct Answer
verified
Multiple Choice
In this landscape,choose the location that you think would be best for agricultural fields. 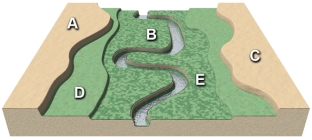
A) Location A
B) Location B
C) Location C
D) Location D
E) Location E
G) C) and D)
Correct Answer

verified
Correct Answer
verified
Multiple Choice
In the accompanying hydrograph for major river,a flood was caused by a single episode of heavy rainfall 50 kilometers upstream.When did the rain most likely occur? 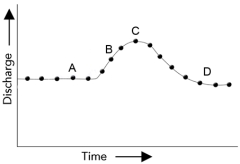
A) at time A
B) at time B
C) at time C
D) at time D
F) A) and C)
Correct Answer

verified
Correct Answer
verified
Multiple Choice
What is the pattern of discharge shown by this hydrograph? 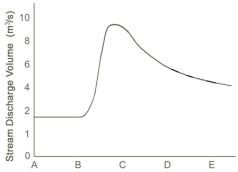
A) discharge gradually increases and quickly decreases
B) discharge quickly increases and gradually decreases
C) discharge gradually decreases and quickly increases
D) discharges quickly decreases and gradually increases
F) B) and D)
Correct Answer

verified
Correct Answer
verified
Multiple Choice
Which of the following is true of a 100-year flood?
A) a 100-year flood occurs every 100 years on a given stream
B) the probability of a 100-year flood occurring on any given year is 1:100
C) a 100-year flood cannot occur twice within 10 years
D) the probability of a 100-year flood is related to how recently the last 100-year flood occurred
F) A) and B)
Correct Answer

verified
Correct Answer
verified
Multiple Choice
Which of the following does NOT influence whether sediment is picked up by a stream?
A) size and density of the sediment
B) turbulence of the moving water
C) location of the sediment in the stream
D) whether the stream flows north-south or east-west
F) A) and B)
Correct Answer

verified
Correct Answer
verified
Multiple Choice
What happens to water velocity downstream? It generally: 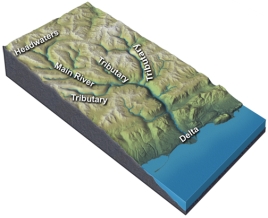
A) Decreases
B) remains the same
C) increases
D) there is no way to tell because discharge cannot be determined
F) B) and C)
Correct Answer

verified
Correct Answer
verified
Multiple Choice
Which of the following is NOT associated with many braided streams?
A) an abundant supply of sediment
B) a broad sediment-covered plain
C) a range of sediment sizes,including sand and gravel
D) cutoff meanders
F) B) and C)
Correct Answer

verified
Correct Answer
verified
Multiple Choice
Which of the following statements about streams is NOT true?
A) base level is the lowest elevation to which a stream can erode
B) a steep stream high above base level generally will be eroding its channel
C) some streams can simply transport material instead of eroding or depositing material
D) streams typically do not respond to a change in climate
F) None of the above
Correct Answer

verified
Correct Answer
verified
Multiple Choice
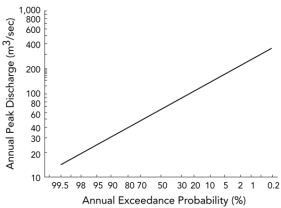
The lowest notch shown on this figure is 9 meters wide and 5 meters high from its base.The river has a velocity of 1 meter per second when it fills the notch.Based on the accompanying graph,what is the probability each year that the notch will be filled to the top? 
A) 90 to 95%
B) 60 to 80%
C) 40 to 45%
D) less than 40%
E) none of these
G) C) and E)
Correct Answer

verified
Correct Answer
verified
Multiple Choice
This figure shows four numbered river terraces,with 1 being the highest and 4 being the lowest.Which is the oldest terrace? 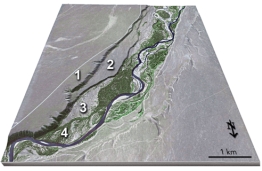
A) 1
B) 2
C) 3
D) 4
F) B) and C)
Correct Answer

verified
Correct Answer
verified
Multiple Choice
What could cause a canyon to be deeper upstream than downstream? 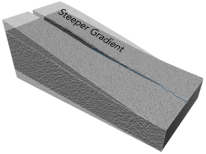
A) the area upstream could be uplifted more than areas downstream
B) the area upstream is higher above base level and so results in deep erosion
C) a steeper gradient allows more erosion upstream
D) all of these
F) A) and C)
Correct Answer

verified
Correct Answer
verified
Multiple Choice
On this graph of discharge versus season for a river in the Rocky Mountains,why is the highest runoff likely to be in the spring? 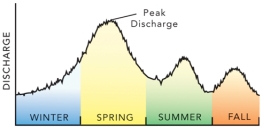
A) winter snow melts in the spring
B) the Rocky Mountains have many tornadoes during the spring
C) the Rocky Mountains experience hurricanes in the spring
D) all of these
F) A) and D)
Correct Answer

verified
Correct Answer
verified
Multiple Choice
Construction of a dam results in: 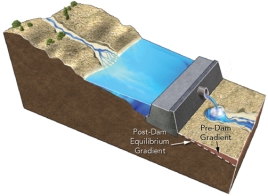
A) an increase in the total amount of water flowing downstream of the dam
B) increased erosion by clear water released from the dam
C) the dam releasing water that contains more sediment than carried by the river before the dam was constructed
D) increased erosion where the stream channel meets the reservoir
F) B) and D)
Correct Answer

verified
Correct Answer
verified
Multiple Choice
Which of the features on this aerial photograph represents the former position of a meander? 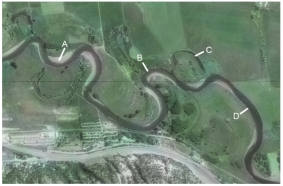
A) A
B) B
C) C
D) D
E) both C and D
G) A) and B)
Correct Answer

verified
Correct Answer
verified
Showing 61 - 80 of 109
Related Exams